Burndown Charts
Why:
Measure how accurate your plan is on time.
How:
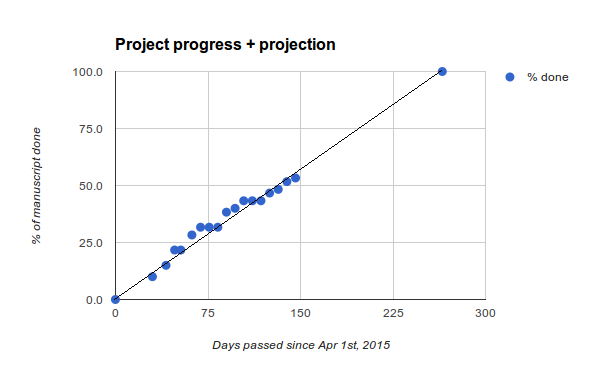
Draw a diagram with the remaining time on the x-axis (until a set deadline) and the number/estimated size of tasks to do on the y-axis. Draw a diagonal line from the top left to the bottom right corner. Each day/week, draw a dot representing which of the tasks are finished at that time point. When the dots are below the diagonal, the project is right on time, when they are above, the project runs late.
Hints:
You can use Excel, but usually, a paper diagram suffices.
Burndown charts are neither good for showing off nor pointing out inability. They just measure where you are standing and allow you to react and adapt early.
I find myself using Burndown Charts in writing projects over and over again. Mapping chapters, lines translated or the number of blog posts to a time scale works out surprisingly well.