Edit columns
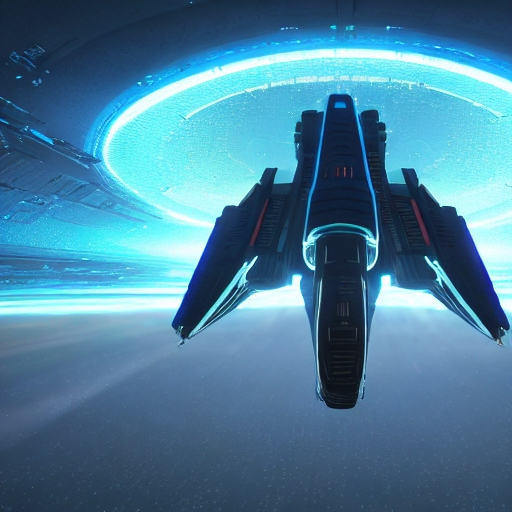
Planetary Descent
Finally you decide to land on the planet of the mysterious penguins. Because your ship is not equipped with teleportation, your delegation will have to take a shuttle to the surface. Your job is to bring them down safely.
Currently, your ship (and the shuttle) is orbiting in an altitude of 1000 km.
Once the shuttle leaves orbit, the planets gravity accelerates the shuttle constantly by \(10.00 \frac{m}{s^2}\).
At any moment, you can activate the thrusters with an acceleration of \(10.0-100.0\frac{m}{s^2}\).
You can change the strength of the thrusters or deactivate them
Reach an altitude and speed of exactly 0 to safely land on the surface.
Let's simulate the landing to find a good timing for activating the thrusters.
Create a DataFrame with a single column
Simulate the ships' altitude over time with a resolution of one second. Start by creating the time as a column. 1000 seconds should be enough:
import pandas as pd
import numpy as np

seconds = np.arange(1000, dtype=np.int32)
df = pd.DataFrame({'seconds': seconds})
The dictionary format in the parentheses allows you to define a DataFrame with multiple columns as well.
Could I use range() instead of np.arange?
Yes. You would need to convert the output to a list with list(range(...)).
NumPy is faster and more flexible when you want to generate larger amounts of numbers though.
Also you have access to C++ data types.
Add columns
Because the gravity does not change, we create a new column and fill it up with one value:
df['gravity'] = 10.00
For the thrust, we create a new column, settting all values to zero:
df['thrust'] = 0.0
An alternative is to create a NumPy array or list first. This works as long as the size of the array matches the shape of the DataFrame:
rows = df.shape[0]
df['thrust'] = np.zeros(rows)
If you re-assign to an existing column, the old column gets replaced.
Modify a column
Now we need to switch on the thrusters. Use df.loc to fire the thrusters for a given time period:
df.loc[500:600, 'thrust'] = 100
This will activate the thrusters from second 500 to 600 with a strength of 100.
Column arithmetics
We can create new columns using math equations:
df['acceleration'] = df['gravity'] - df['thrust']
To calculate the speed, we need to add all acceleration values up to a given row:
df['speed'] = df['acceleration'].cumsum()
Inspect the data with df.head() to see the effect of the .cumsum() method.
Adding up the speed column lets you calculate the altitude:
df['altitude'] = 1000 - (df['speed'].cumsum() / 100)
Shouldn't we use differential calculus to solve this problem?
The pandas spaceship is equipped with quantum displacement technology that dynamically modifies the Planck constant. So technically, the ship is performing a series of very small jumps in space-time.
A side effect of this is that the acceleration gently strokes your fur while the ship is descending and you would not want to mess with that.
Remove a column
The seconds column was useful in the beginning, so that the DataFrame was not empty. But we do not really need it for the calculation. To remove it, use:
df.drop('seconds', axis=1, inplace=True)
The argument axis=1 refers to columns (axis=0 deletes rows). The inplace=True modifies the DataFrame.
Zooming in
To highlight the area with the lowest altitude, you can use the following code:
lowest = df[df["altitude"] == df['altitude'].min()]
df.iloc[:lowest.index[-1] + 5].tail(10)
Visualize the descent
Let's plot the outcome of the simulation. A simple line plot is sufficient. We add a horizontal line to indicate the surface.
from matplotlib import pyplot as plt

df['altitude'].plot()
plt.hlines(xmin=0, xmax=1500, y=0.0, color="red")
To debug the descent, it may help to see the speed as well. We can show both columns in a line plot, but need to switch to a log-scale (both for comparability and precision).
ax = df[['altitude', 'speed']].plot()
ax.set_yscale('log')
When you see that your altitude goes through the floor of the log plot, it means that the spaceship would crash into the planet.

Challenge
Once you reach an altitude of exactly 0 m and a speed of exactly 0 m/s, your anti-gravitational landing gear will finish the landing automatically.
Add as many thruster activations as you need using the pattern:
df.loc[start_time:end_time, 'thrust'] = strength
The following code checks whether the landing was successful:
lowest = df[df["altitude"] == df['altitude'].min()].iloc[-1]
if lowest['altitude'] == 0 and lowest['speed'] == 0:
    print("landing successful!")