Pivot Tables
Penguin Tribes
Your scientists come with exciting news: they have discovered that the penguins are also black and white! Maybe both people have emerged from the same space-traveling ancestor?
There seem to be three big tribes of penguins with remarkably distinct heads:
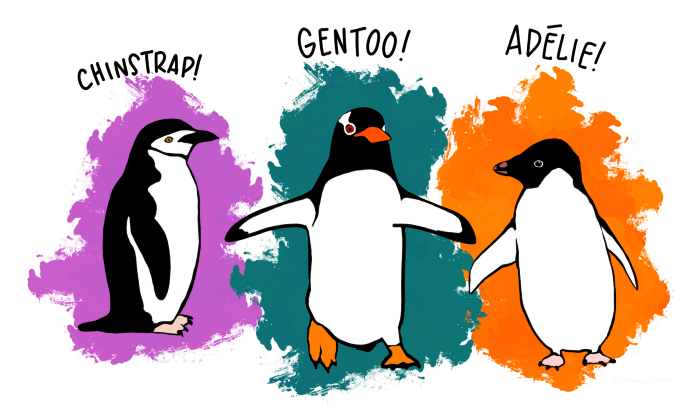
Palmerpenguins Artwork by @allison_horst
You need to find more about them!
import seaborn as sns

df = sns.load_dataset("penguins")
Pivot Tables
A pivot table is a generic summary of tabular data that is well-known from spreadsheet tools. It creates a table where the rows and colums are defined by categorical columns of the data.
To create a simple pivot of your data, you need to have at least one categorical and one numerical column and a function that aggregates data:
categories + numbers + aggregation function -> pivot
Let's examine one example:
pd.pivot_table(
   data=df,
   index="island",
   values="bill_length_mm",
   aggfunc="mean"
)
Here, each distinct value in index results in a separate row. The values parameter defines which column will be used for aggregation.
Pivot Tables with rows and columns
Many times, you will use two categorical columns so that the pivot table has multiple columns. In that case, one categorical column defines the rows, the other defines the columns of the pivot table:
categories1 + categories2 + numbers + aggregation function -> pivot
The code requires one more line:
pd.pivot_table(
   data=df,
   index="island",
   columns="sex",
   values="bill_length_mm",
   aggfunc="count"
)
The column parameter lets each distinct gender result in a separate column.
Counting works with any column as values, but None is ignored.
Aggregation Functions
There are just a few aggregation functions that cover most statistical functions:
count
sum
mean
std (the standard deviation)
min
max
You could use your own functions with pd.pivot_table but this is out of scope for this tutorial.
Normalizing
When creating pivot tables with count data, you often will want to know the relative frequencies or percentage of each item. This is an example of normalizing data.
Assume we have the pivot:
piv = pd.pivot_table(
   data=df,
   index="island",
   columns="sex",
   values="bill_length_mm",
   aggfunc="count"
)
You can normalize over the rows, so that the relative frequencies sum up to 1.0 for each island:
piv / piv.sum()
If you want to normalize for each gender instead, you need to transpose the table first:
piv.T / piv.T.sum()
Finally, to normalize the entire table, so that everything adds up to 1.0, you need to divide by the grand total:
piv / piv.sum().sum()
Bar Plots
One key feature of pivot tables is that they reduce the size of the data considerably. The pivoted data usually can be displayed well as a bar plot:
piv.plot.bar()
This works for all pivots and their normalizations!

Challenge
Examine the penguin scan data further:
import seaborn as sns

df = sns.load_dataset('penguins')
Answer the following questions:
how many penguins are in which species?
how many penguins from which species live on which island?
what is the average body mass of each species?
how long is the longest beak of each species?
what is the mean of each numerical column, per species?
what is the mean bill length and depth for each species/sex combination?