Beakonomics
Goal: Create a short data report about penguin beaks.
Exercise 1: Read data
Read the penguin data from the file penguins.csv.
With Python, you can read the penguins dataset from the seaborn library directly:
import seaborn as sns

df = sns.load_dataset('penguins')
df.head()
Exercise 2: Group by a category
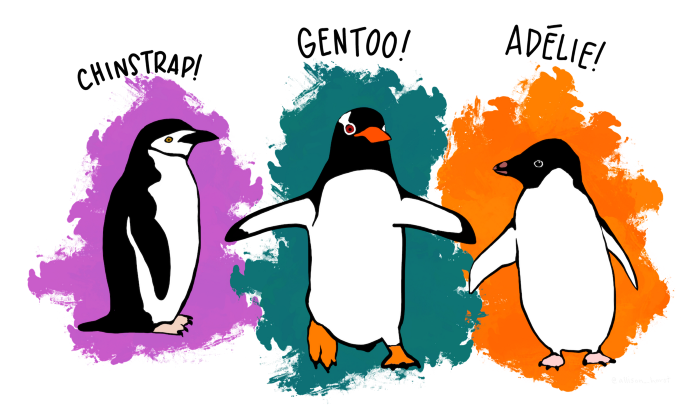
Count the penguins by species:
df["species"].value_counts()
Hint
This is the same as the COUNTIF function in a spreadsheet, e.g.
COUNTIF(B$2:B$333,C$2:C$4)
Exercise 3: Group means
Calculate the mean beak size for each species:
df.groupby("species")["beak_length"].mean()
Exercise 4: Plot by a category
Plot the group counts as a bar plot by adding .plot.bar()
Try the same for the grouped means.
Exercise 5: Group by two categories
You can also group by two categorical variables. To make the data easy to read, place one categorical variable in the rows and the other in the columns of the table. This is called a crosstable or pivot table:
pivot = df.groupby(["species", "sex"])["beak_length"].count().unstack()
pivot
Creates a pivot table grouping the penguin count for each gender and species.
Exercise 6: Plot the pivot table
Plot the pivot tables as a grouped bar plot:
pivot.plot.bar()
Exercise 7: Pivot average
Calculate a pivot table showing the average beak size for every combination of species/gender.
Exercise 8: Normalized counts
Normalize the pivot table of penguin count by species/gender, so that each cell contains relative frequencies:
normalized = pivot / df.shape[0] # divide by number of data points
What other options for normalization do you have?
Exercise 9: Normalize by min/max
A different way to normalize data is to scale the data. We will use the min and max to scale the original data.
Try the equation:
Exercise 10: z-Score
The last type of normalization in this section is to take the mean and standard deviation into account. This is called standard scaling or z-score:
Use the equation:
What do the numbers mean?
Exercise 11: Penguin Beak Report
Explore the penguin data further:
How does a typical penguin beak look like?
What is the distribution of beak lengths and widths for different species?
Which species have long and slim beaks, which are rather short and wide?
Are the beak sizes in the most prevalent species correlated with any other feature of a penguin?
Answer each question with a diagram and formulate a textual answer (1-2 sentences). Decide on your own what kind of plot answers the question best. If necessary, reshape or normalize the data.
Write down 3-5 sentences describing the beaks of the penguins in the data. Use the mean, median and standard deviation and the knowledge gained from the above exercises.