How to plot a bar chart?
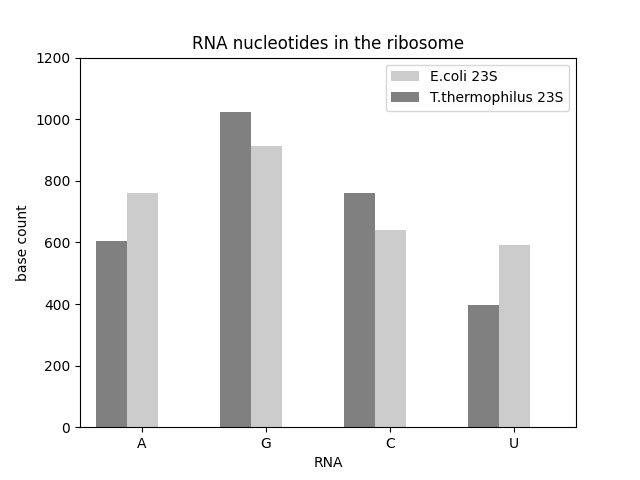
matplotlib is capable of producing static images of all common types of diagrams in print quality: line plots, scatter plots, bar charts, pie charts, histograms, heat maps etc. The library is somewhat oldschool – it was written to produce diagrams for printed documents. For more interactive graphics for the web, consider altair, bokeh or plotly.
Install matplotlib with:
pip install matplotlib
The following code produces a bar chart:
from matplotlib import pyplot as plt

nucleotides = ["A", "G", "C", "U"]

counts = [
    [606, 1024, 759, 398],
    [762, 912, 639, 591],
    ]

plt.figure()

x1 = [2.0, 4.0, 6.0, 8.0]
x2 = [x - 0.5 for x in x1]

plt.xticks(x1, nucleotides)

plt.bar(x1, counts[1], width=0.5, color="#cccccc", label="E.coli 23S")
plt.bar(x2, counts[0], width=0.5, color="#808080", label="T.thermophilus 23S")

plt.legend()
plt.axis([1.0, 9.0, 0, 1200])

plt.title('RNA nucleotides in the ribosome')
plt.xlabel('RNA')
plt.ylabel('base count')
plt.savefig('barplot.png')
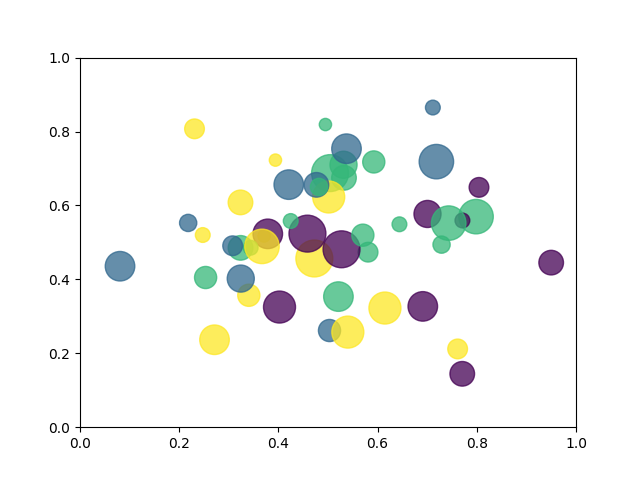
How to draw a scatterplot?
import math
import random
from matplotlib import pyplot as plt

# prepare random data
n_balls = 50
x = [random.triangular() for i in range(n_balls)]
y = [random.gauss(0.5, 0.15) for i in range(n_balls)]
colors = [random.randint(1, 4) for i in range(n_balls)]
areas = [math.pi * random.randint(5, 15)**2 for i in range(n_balls)]

# draw the figure
plt.figure()
plt.scatter(x, y, s=areas, c=colors, alpha=0.75)
plt.axis([0.0, 1.0, 0.0, 1.0])
plt.savefig('balls.png')
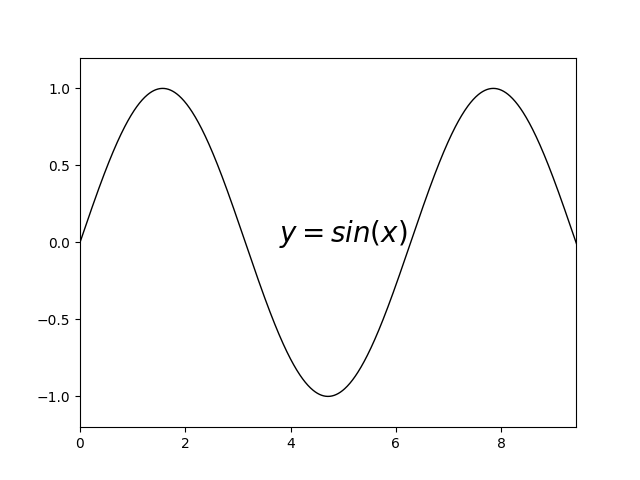
How to draw a line plot?
from matplotlib import pyplot as plt
import math

plt.figure()

x = [0.01 * i for i in range(1000)]
y = [math.sin(j) for j in x]

plt.plot(x, y, 'k-', linewidth=1)
plt.text(5, 0, "$y = sin(x)$", horizontalalignment='center', fontsize=20)
plt.axis([0, 3*math.pi, -1.2, 1.2])

plt.savefig('sinfunc.png')
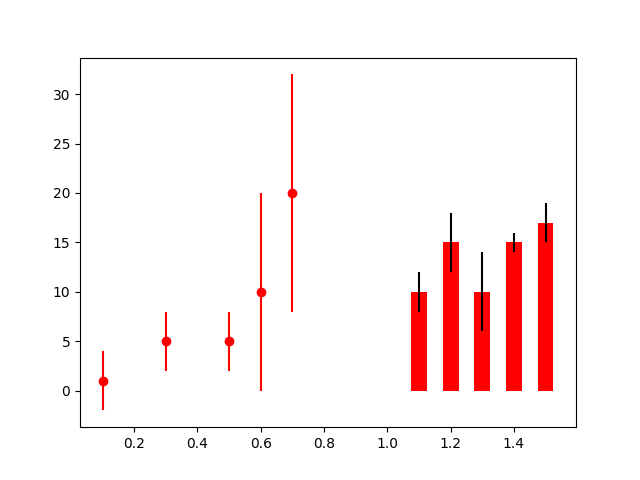
How to draw error bars?
from matplotlib import pyplot as plt

plt.figure()

# scatterplot with error bars
x1 = [0.1, 0.3, 0.5, 0.6, 0.7]
y1 = [1, 5, 5, 10, 20]
err1 = [3, 3, 3, 10, 12]
plt.errorbar(x1, y1, err1, fmt='ro')

# barplot with error bars
x2 = [1.1, 1.2, 1.3, 1.4, 1.5]
y2 = [10, 15, 10, 15, 17]
err2 = (2, 3, 4, 1, 2)
width = 0.05
plt.bar(x2, y2, width=width, color='r', yerr=err2, ecolor="black")

plt.savefig('errorbars.png')
How to draw a pie chart?
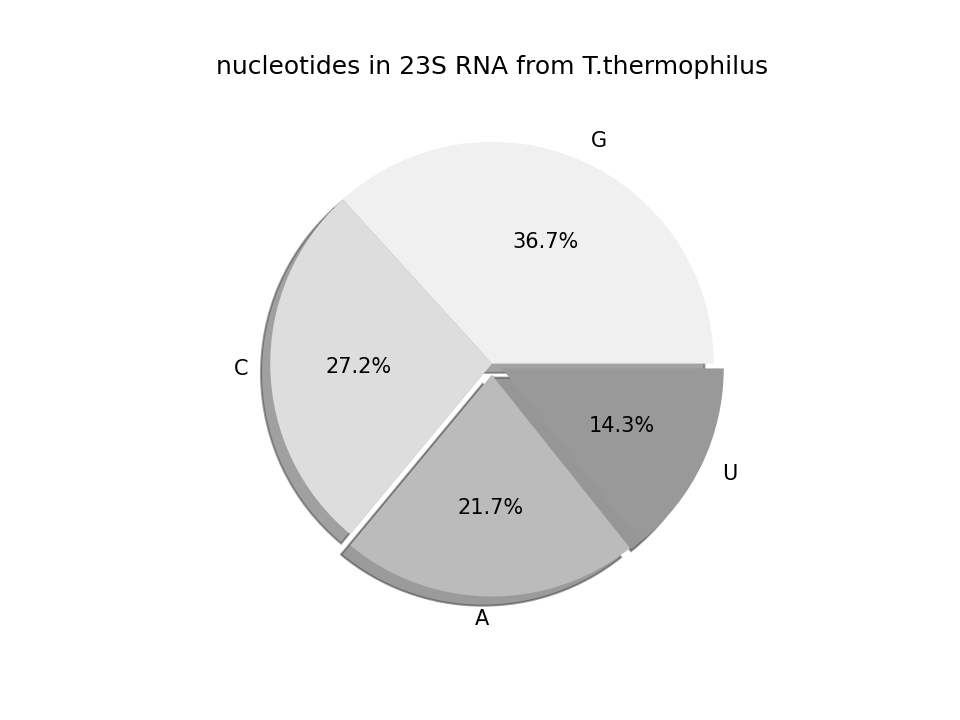
from matplotlib import pyplot as plt

nucleotides = 'G', 'C', 'A', 'U'
count = [1024, 759, 606, 398]
explode = [0.0, 0.0, 0.05, 0.05]

colors = ["#f0f0f0", "#dddddd", "#bbbbbb", "#999999"]

plt.figure(1)
plt.title('nucleotides in 23S RNA from T.thermophilus')

plt.pie(count, explode=explode, labels=nucleotides, shadow=True,
    colors=colors, autopct='%.1f%%')

plt.savefig('piechart.png', dpi=150)
See also
A good way to learn what you can do is to browse the examples gallery on matplotlib.org.
You find a comprehensive tutorial in the Scipy Lectures.