How to plot a graph?
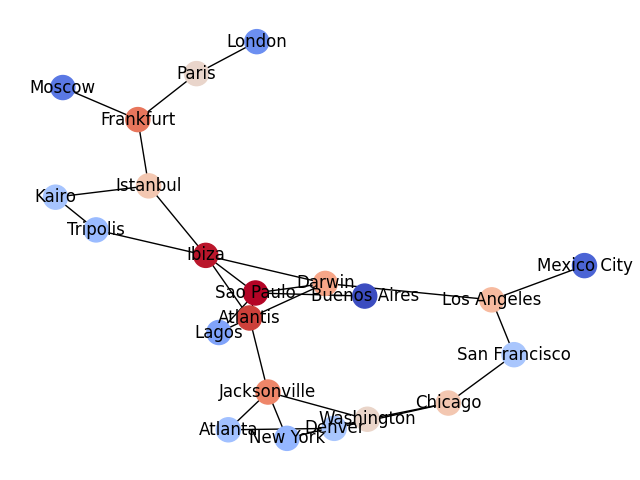
The NetworkX library processes and plots graphs.
Install it with:
pip install networkx
The example below uses the PageRank algorithm to calculate the centrality (relative importance) of nodes in the graph. The nodes are colored according to their page rank score (more red=more central).
The code uses the data in city_pairs.csv:
# draw a graph between cities and color by PageRank

import pandas as pd
import networkx as nx
import matplotlib.pyplot as plt


pairs1 = pd.read_csv("city_pairs.csv", names=["city1", "city2"])
pairs2 = pd.read_csv("city_pairs.csv", names=["city2", "city1"])
pairs = pd.concat([pairs1, pairs2])

# create adjacency matrix
cities = pd.crosstab(pairs["city1"], pairs["city2"])

# create graph object with NetworkX library
g = nx.from_pandas_adjacency(cities)

# calculate node centrality with the PageRank algorithm
rank = nx.pagerank(g, alpha=0.80)
cities["rank"] = pd.Series(rank) / max(rank.values())

# draw graph, color by rank
plt.figure()
nx.draw(g, node_color=cities["rank"], cmap='coolwarm', labels=dict(zip(g.nodes(), g.nodes())))

plt.savefig("pagerank.png")
See also