Paper-and-Scissor Worksheets
This is an example of having students build a software architecture using paper and scissors.
Goal
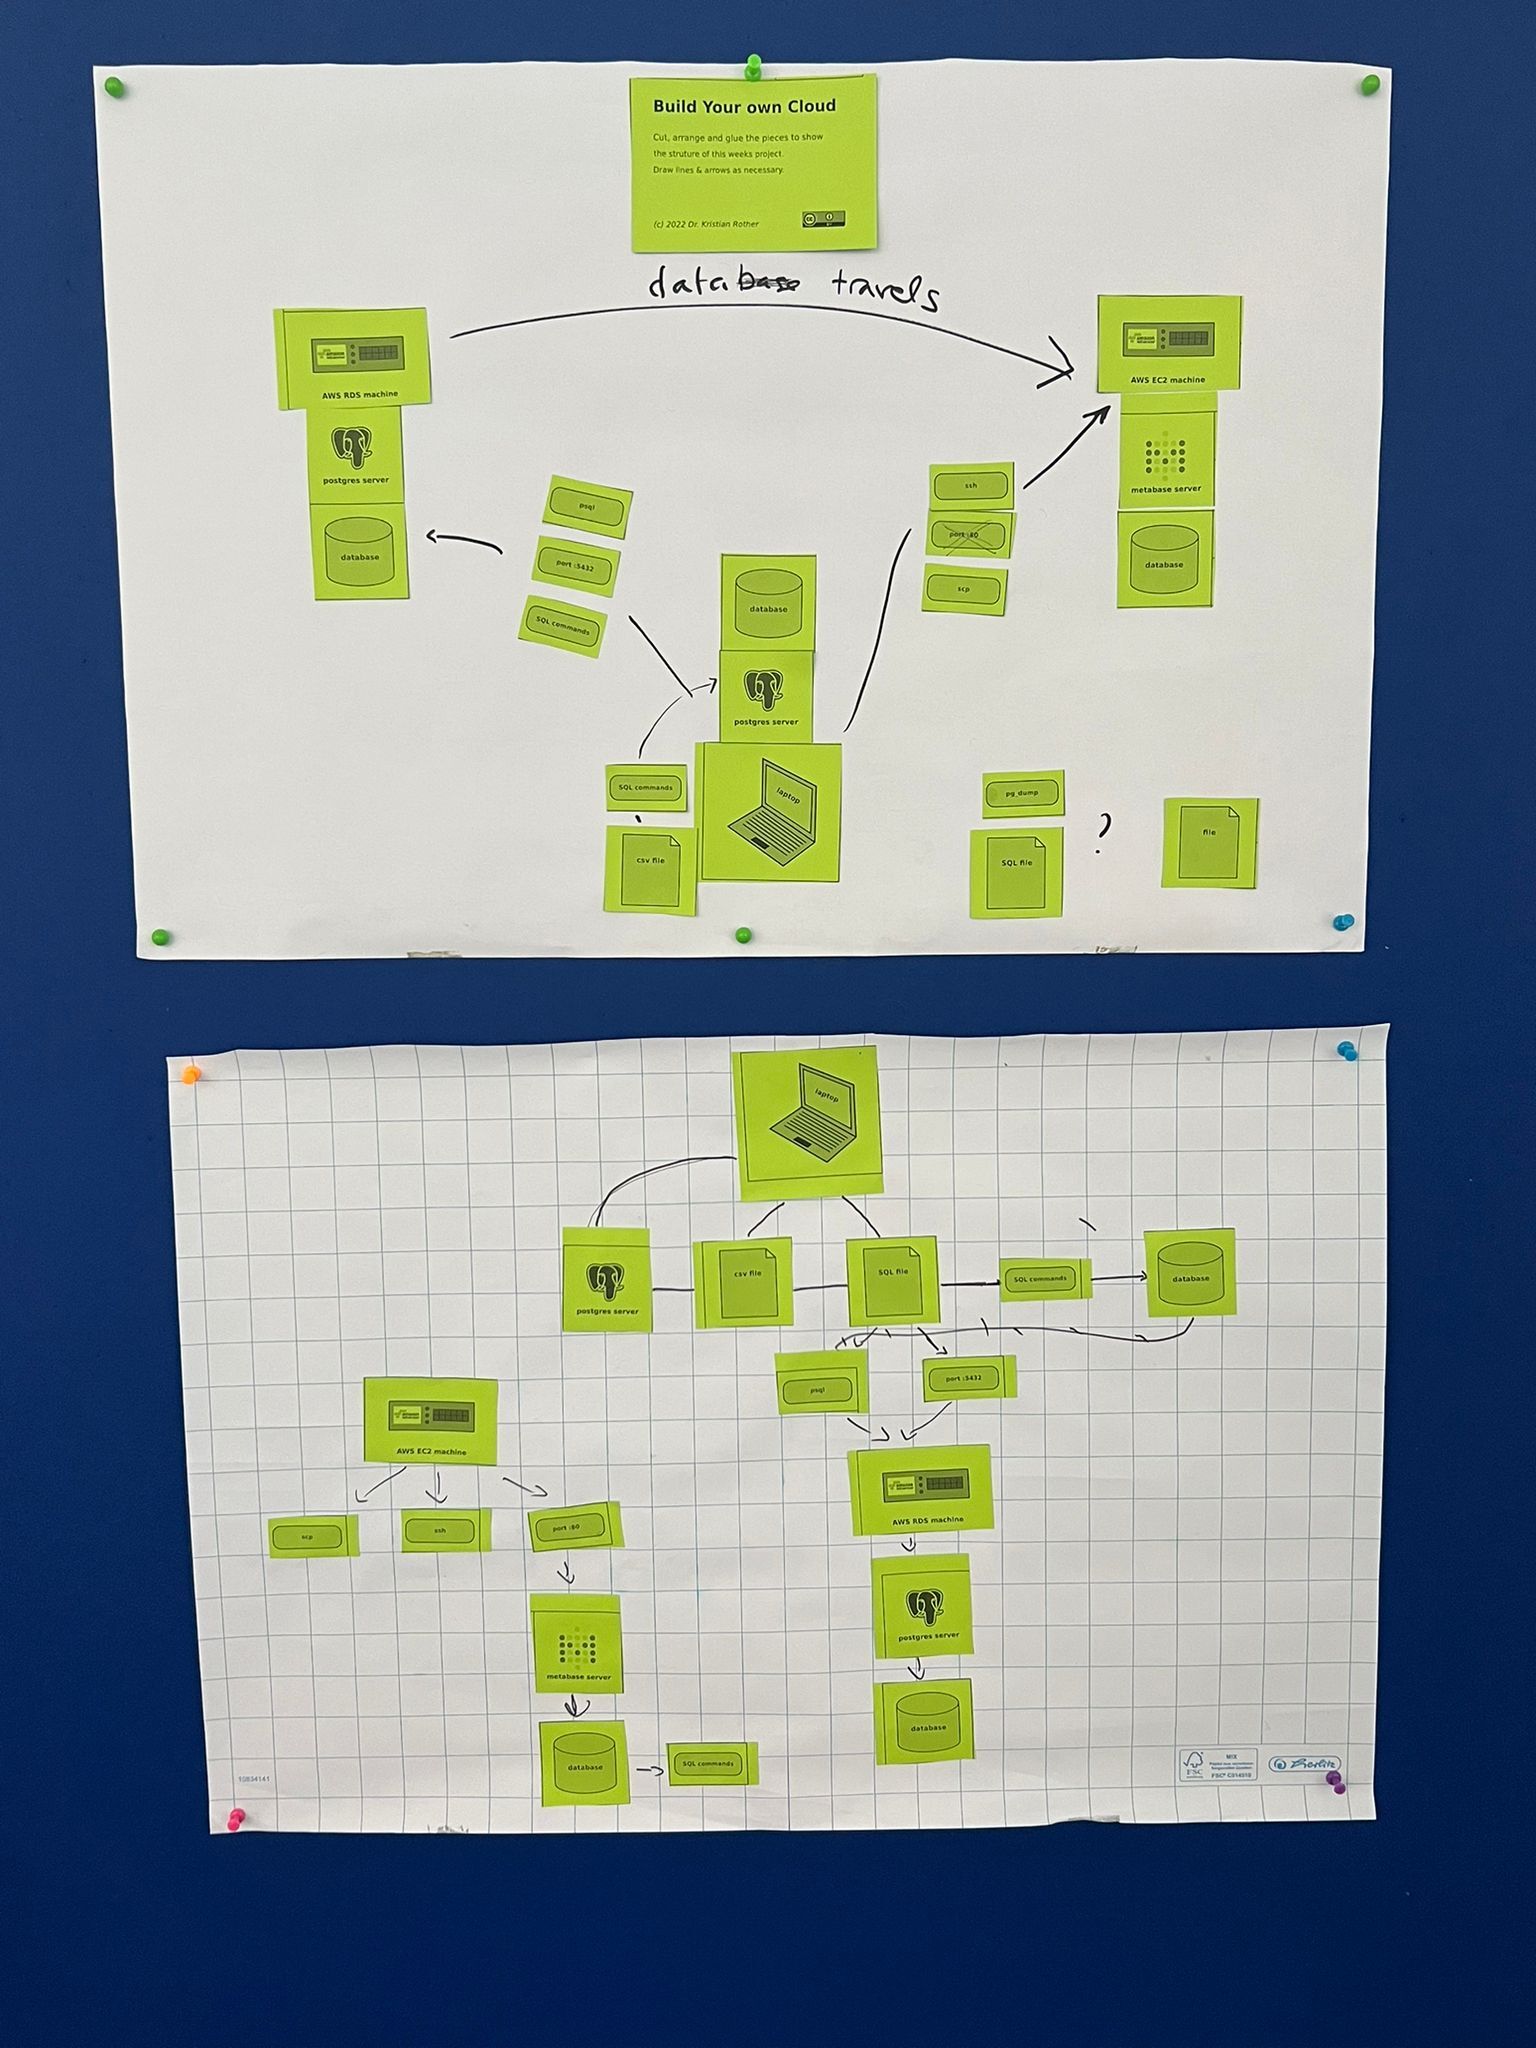
The students visualize the interactions between 3 computers in a classroom project. They would receive a worksheet like this one (download the SVG file :::file pg_worksheet.svg ):

The students would cut, arrange and glue the elements to explain what they have done in a project. This helps them to clarify, which computer or program communicates with which other. The students basically create their own concept map in a inductive instruction setting. The activity clarifies or at least exposes unclear points in the follow-up discussion.
There are two ways to use a worksheet like this one:
To introduce a new topic or project. In this case you need reading material where students find what they should build.
To recap a project students have been working on
Preparations
you need:
reading material (only if you go for option 1)
print the PDF N+1 times (N = number of students // 3) on 120g paper in a bright colour
large sheets of paper (A2, flipchart cut in half)
scissors for each group
glue sticks for each group
some black pens
How to do it
Announce the task: create an overview of the project using the paper parts
They don’t have to use all the parts
Randomly assign the students to groups of 2-3 people
Give them 30-40 minutes to work on the material
Put up the results on pin walls as a sort of gallery
Let each group briefly(!) present their outcome, answer questions
This is how the result could look like: